
What are candles sticks
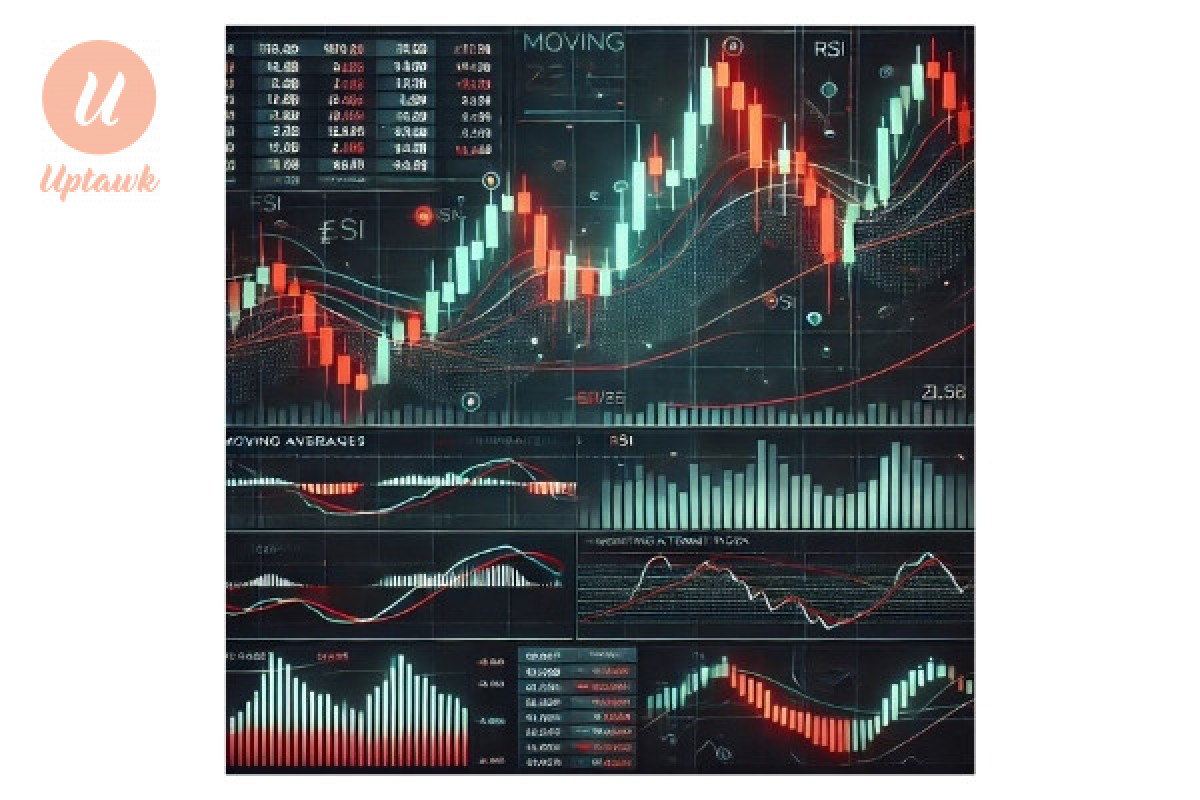
Candlestick Charts are one of the most widely used tools in Forex trading for analyzing price movements. They provide valuable insights into market sentiment, trend direction, and potential reversals. Here’s a detailed breakdown of candlesticks in the context of forex trading:
What is a Candlestick?
A candlestick is a graphical representation of price movements within a specific time frame (e.g., 1 minute, 1 hour, 1 day). Each candlestick displays four key price points:
1) Open Price: The price at which the currency pair starts during the selected time frame.
2) Close Price: The price at which the currency pair ends during the selected time frame.
3) High Price: The highest price reached during the time frame.
4) Low Price: The lowest price reached during the time frame.

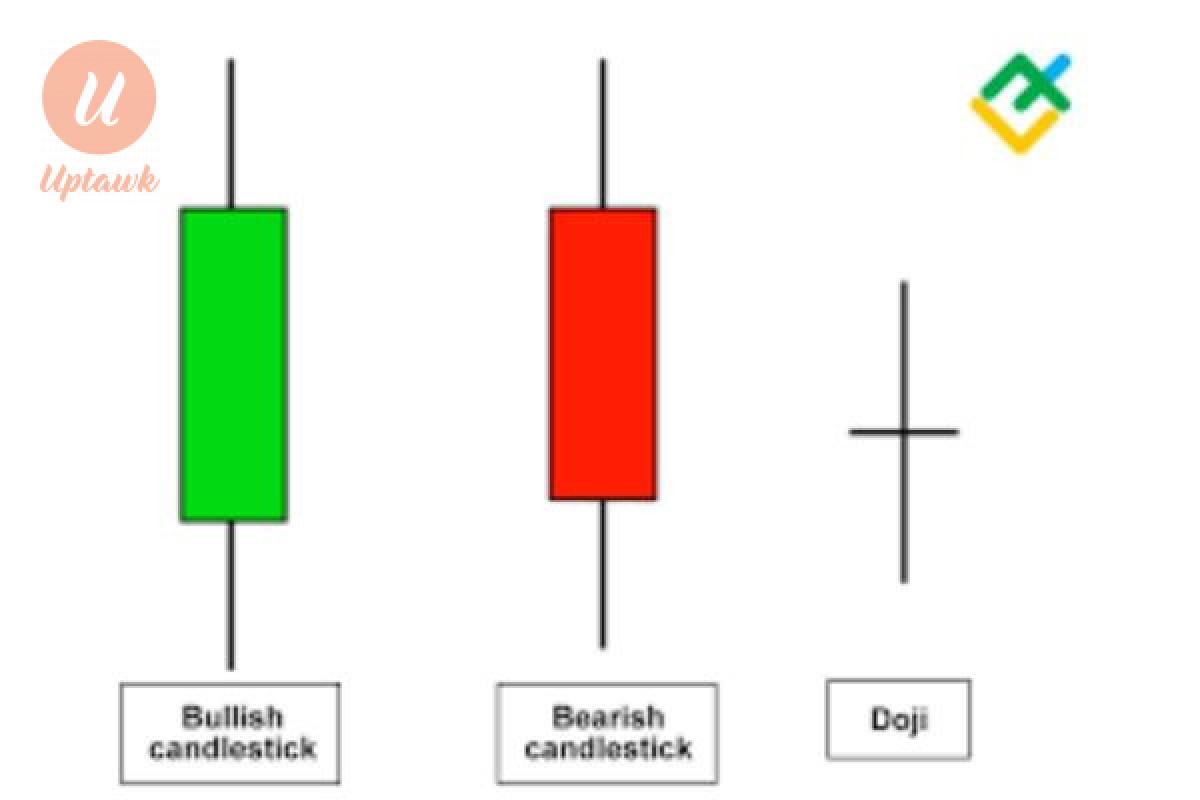
Structure of a Candlestick
A candlestick consists of two main parts:
1) Body: The rectangular area between the open and close prices.
2) Wicks (or Shadows): The thin lines above and below the body, representing the high and low prices.

The color of the candlestick indicates price movement:
a) Bullish (Green or White): When the closing price is higher than the opening price, indicating an uptrend.
b) Bearish (Red or Black): When the closing price is lower than the opening price, indicating a downtrend.
Types of Candlestick Patterns
Candlestick patterns help traders predict future price movements. They are categorized into single, double, and multiple candlestick patterns.
Single Candlestick Patterns:
• Doji: Open and close prices are almost equal, indicating market indecision.

• Hammer: A small body with a long lower wick, signaling potential bullish reversal.

• Shooting Star: A small body with a long upper wick, indicating potential bearish reversal.

Double Candlestick Patterns:
• Engulfing Pattern: A larger candle completely engulfs the previous smaller one, signaling a trend reversal (bullish or bearish).

• Harami: A small candle within the range of the previous larger candle, indicating potential trend continuation or reversal.

Multiple Candlestick Patterns:
• Morning Star: A three-candle pattern that signals a bullish reversal.

• Evening Star: A three-candle pattern that signals a bearish reversal.

• Three White Soldiers: Three consecutive bullish candles, indicating strong upward momentum.

• Three Black Crows: Three consecutive bearish candles, indicating strong downward momentum.

Importance of Candlesticks in Forex Trading
• Identifying Market Trends: Candlestick patterns help traders recognize bullish or bearish trends.
• Finding Entry & Exit Points: Patterns provide signals for entering or exiting trades.
• Market Sentiment Analysis: Candlesticks reflect trader psychology and potential reversals.
• Risk Management: Recognizing reversal patterns helps traders set stop-loss and take-profit levels.
What is Forex trading
What is Forex Trading?
Forex (foreign exchange) trading is the act of buying and selling currencies on the global market to profit from fluctuations
Different Forex Trading Strategies
Before diving into trading strategies, it’s crucial to understand what forex trading is. Forex, or foreign exchange trading, involves buying and selling currency pairs to profit from price fluctuations.
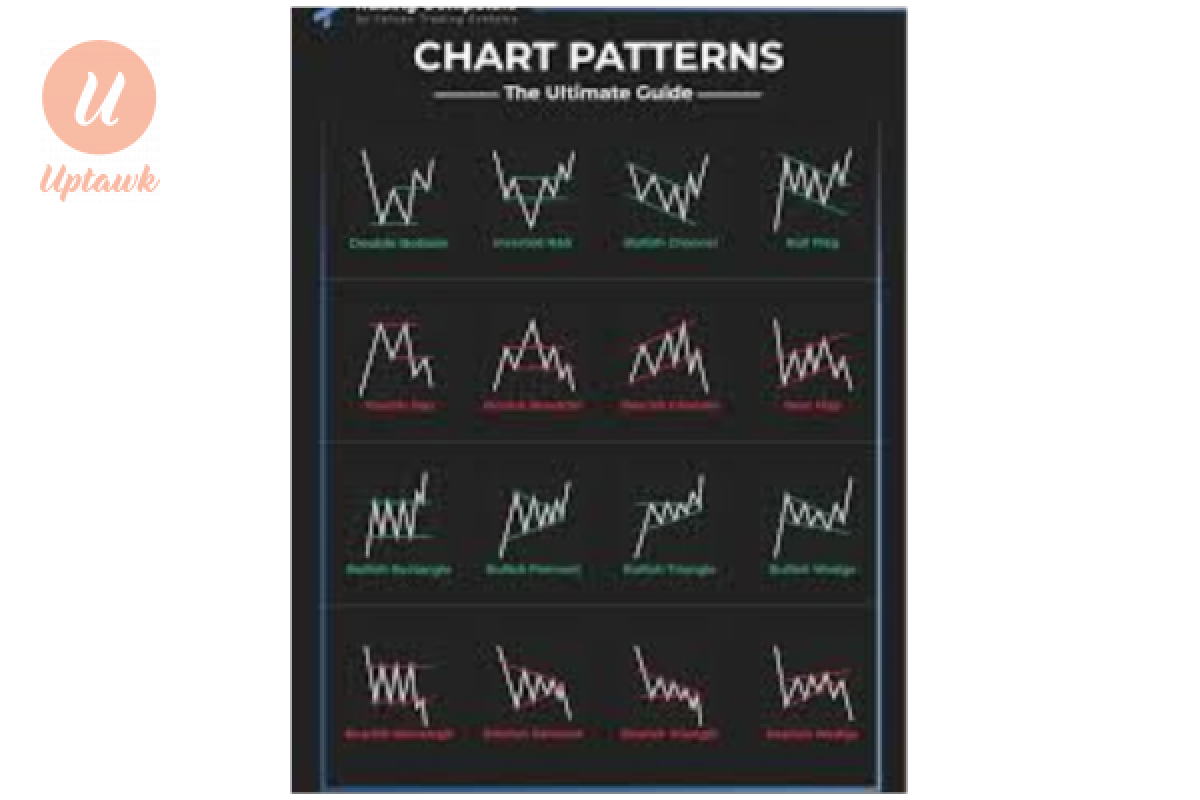
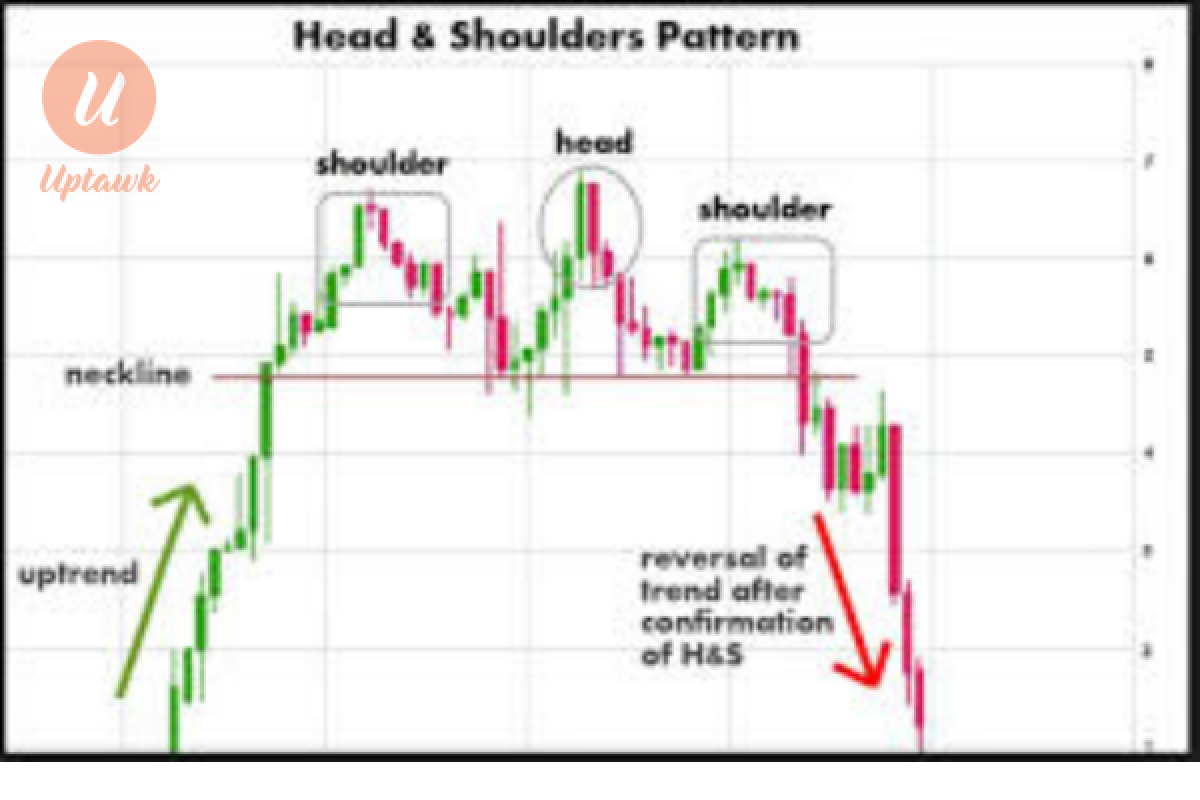
Charts Patterns
Forex trading can be profitable to individual traders but is not without risk. Most traders approach the market hoping to get quick results, but what really happens in forex trading is that it involves
Is Forex Trading profitable?

Comments 0 Comment