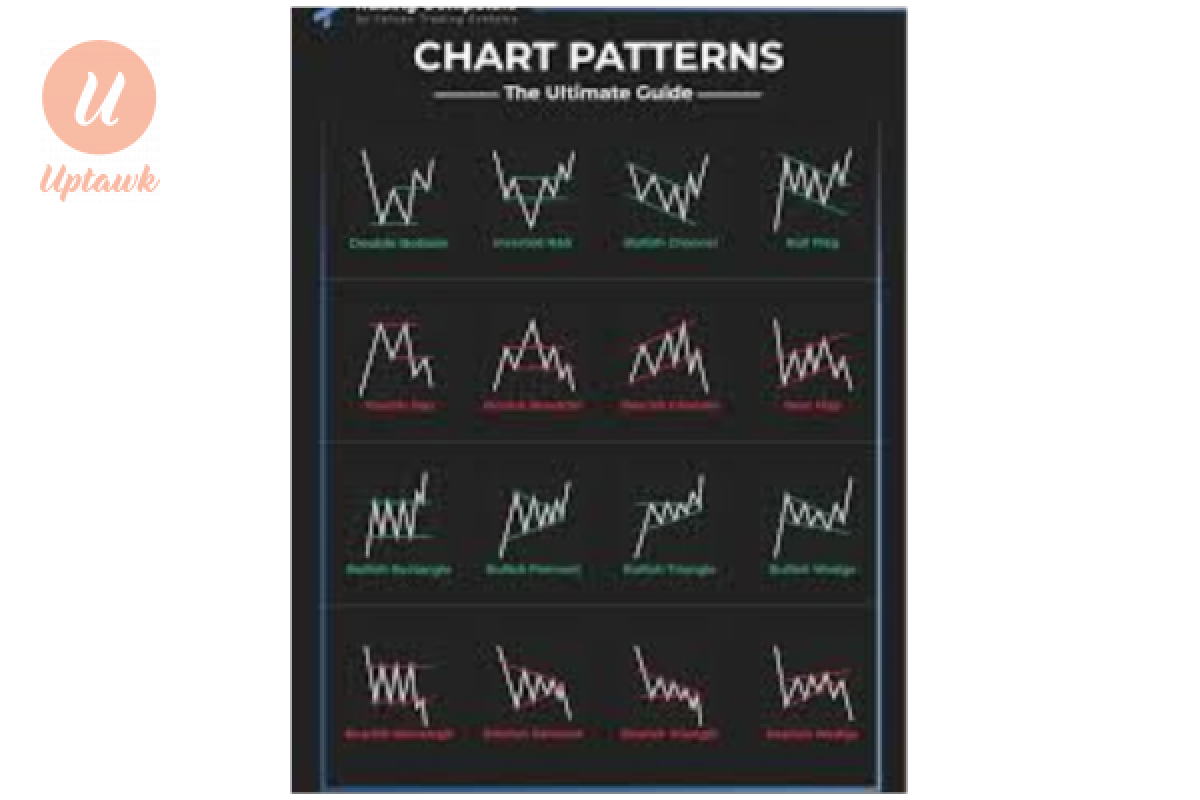

Charts Patterns
Forex trading chart patterns are unique shapes or formations that are seen on price charts, which are utilized by forex traders to predict future price direction. They are formed by the price movement of a currency pair over time and represent an integral component of technical analysis. Traders examine them to decide whether there is going to be a trend, reversal, or continuation in the market.
There are two main categories of chart patterns:
Reversal Patterns
These indicate that the current trend (uptrend or downtrend) is likely to reverse. Examples include:
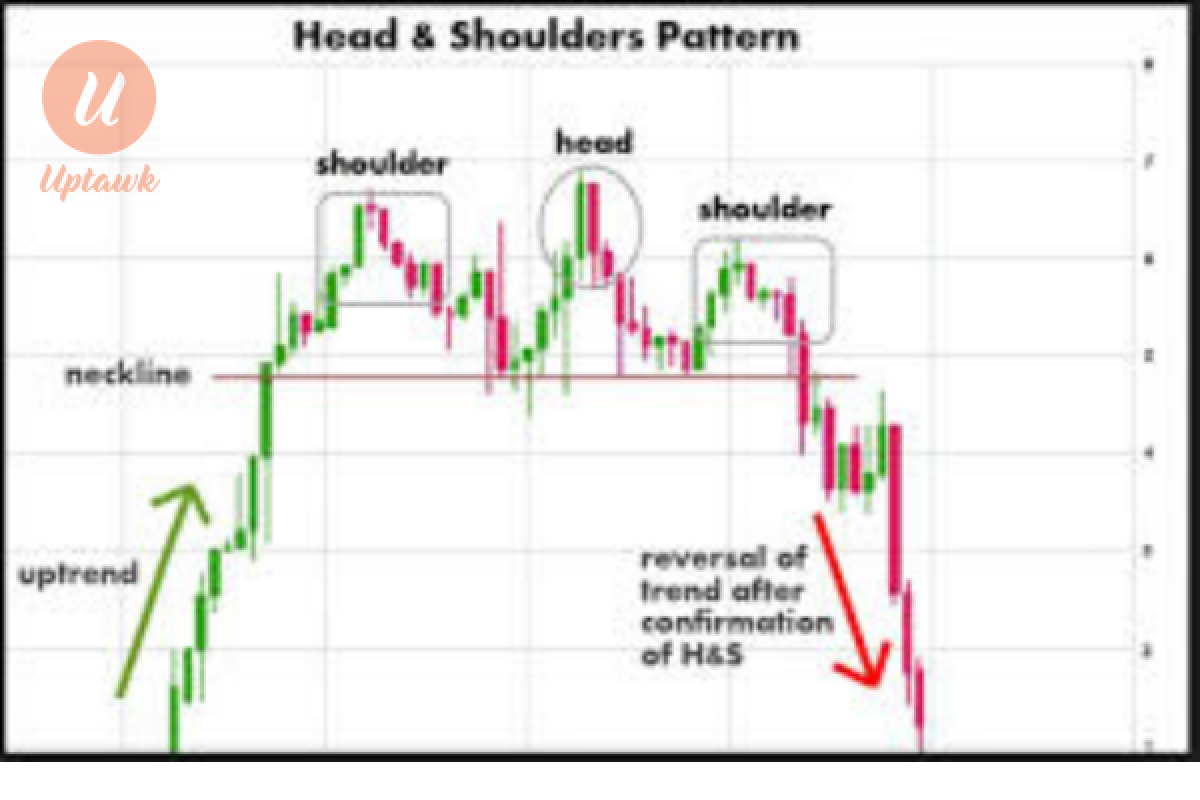
Head and Shoulders: A peak (head) between two smaller peaks (shoulders), signaling a potential reversal from an uptrend to a downtrend 
Double Top/Bottom: Two peaks (top) or troughs (bottom) at roughly the same level, suggesting the trend is about to reverse.
Triple Top/Bottom: Similar to double tops/bottoms but with three peaks or troughs. 
Continuation Patterns
These suggest that the current trend will continue after a brief pause or consolidation. Examples include:
Triangles: Symmetrical, ascending, or descending triangles form when price converges, often leading to a breakout in the direction of the prior trend.

Flags and Pennants: Short-term consolidation patterns that resemble small rectangles (flags) or triangles (pennants), typically followed by a continuation of the trend. 
Rectangles: Price moves sideways between parallel support and resistance levels before breaking out in the trend's direction. 
How They Work in Forex
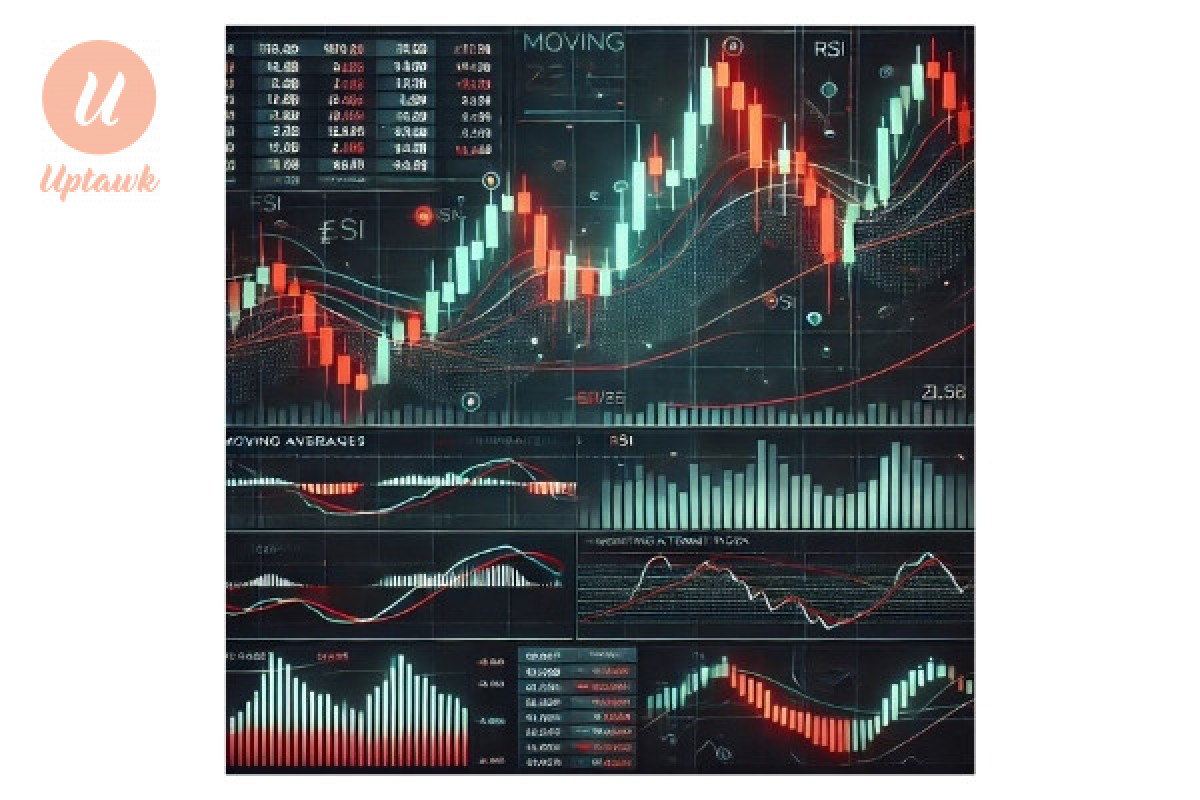
Chart patterns are based on the idea that historical price behavior can repeat itself due to market psychology. Charts Patterns are also used as a trading strategy, to learn more on charts Patterns trading strategies, kindly check out on my forex trading strategies 👉Here and if you're new to forex trading, kindly visit my teaching on what forex trading is right here 👉 "what is Forex Trading". Traders use tools like candlestick charts, line charts, or bar charts to spot these patterns, often combining them with indicators (e.g., moving averages, RSI) for confirmation.
What is Forex trading
What is Forex Trading?
Forex (foreign exchange) trading is the act of buying and selling currencies on the global market to profit from fluctuations
Different Forex Trading Strategies
Before diving into trading strategies, it’s crucial to understand what forex trading is. Forex, or foreign exchange trading, involves buying and selling currency pairs to profit from price fluctuations.
Charts Patterns
Forex trading can be profitable to individual traders but is not without risk. Most traders approach the market hoping to get quick results, but what really happens in forex trading is that it involves
Is Forex Trading profitable?

Comments 0 Comment