

Types of analysis
(1) Technical Analysis
What It Is:
Technical analysis is all about studying past price movements and market behavior to forecast future price action. It’s based on the idea that prices move in trends and that historical patterns repeat due to human psychology. Traders use charts and mathematical tools to spot opportunities.
How It Works:
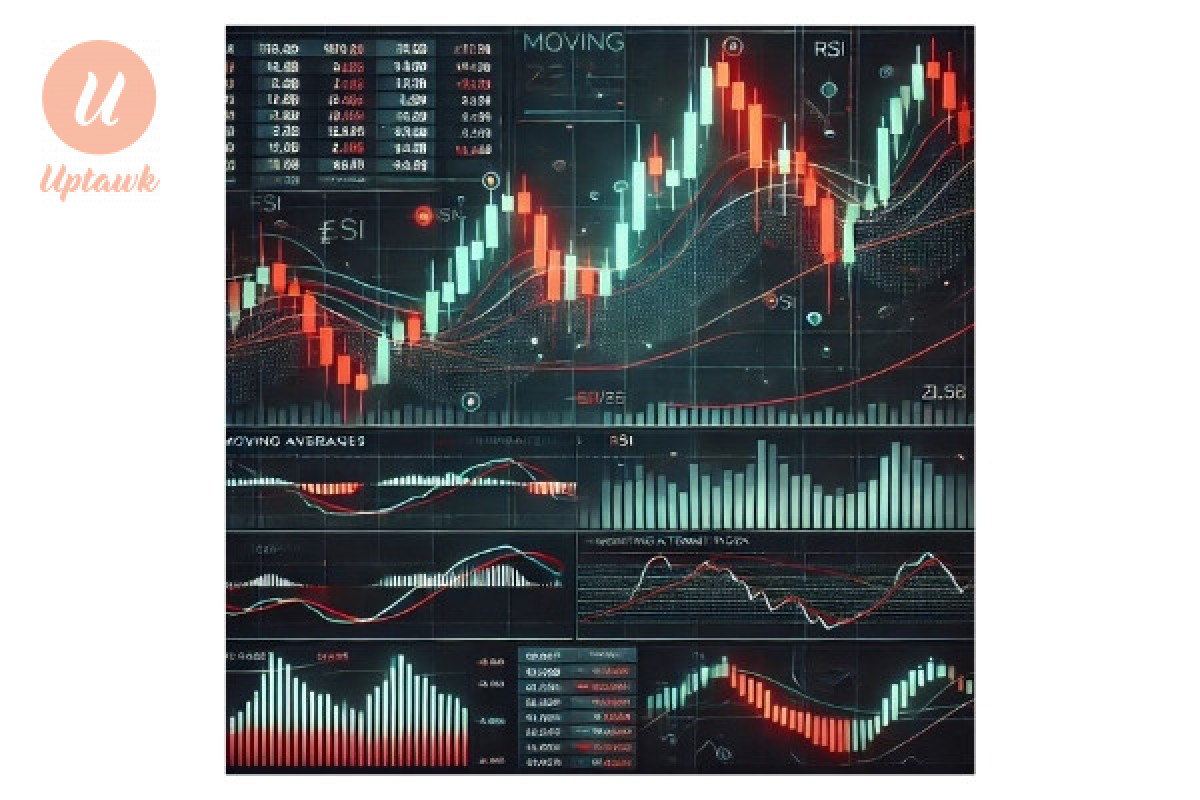
• Charts: Traders analyze candlestick, line, or bar charts over various timeframes (e.g., 1-minute, 1-hour, daily). Candlestick patterns like "doji" or "hammer" can signal reversals or continuations.
- Moving Averages (MA): Smooth out price data to identify trends. A 50-day MA crossing above a 200-day MA (a "golden cross") might signal a bullish trend.
- Relative Strength Index (RSI): Measures momentum (0-100 scale). Above 70 suggests overbought (potential sell), below 30 suggests oversold (potential buy).
- Fibonacci Retracement: Identifies potential support/resistance levels based on key ratios (e.g., 38.2%, 61.8%) after a price move.
- Bollinger Bands: Show volatility and potential breakout points when prices touch the upper or lower bands.• Support and Resistance: Prices often bounce off (support) or get rejected at (resistance) certain levels due to historical buying/selling pressure.
- Example:
- If EUR/USD has been trending upward and pulls back to a 50% Fibonacci level that aligns with a 200-day MA, a trader might see this as a buying opportunity, expecting the uptrend to resume.
- Pros:
- Objective and data-driven.
- Works well for short-term trades (scalping, day trading).
- Cons:
- Ignores economic fundamentals.
- Can fail during unexpected news events.
- Who Uses It: Day traders, scalpers, and anyone who thrives on chart patterns and precision timing.
- (2. ) Fundamental Analysis
- What It Is:
- Fundamental analysis looks at the underlying economic and political forces driving a currency’s value. It’s about understanding why a currency might strengthen or weaken over time based on real-world conditions.
- How It Works:
- Economic Indicators:
- Interest Rates: Higher rates attract foreign investment, boosting a currency. For instance, if the U.S. Federal Reserve raises rates, the USD often strengthens.
- Inflation: Moderate inflation can signal a healthy economy, but hyperinflation (e.g., Zimbabwe’s past) crashes a currency.
- Gross Domestic Product (GDP): Strong GDP growth suggests a robust economy, supporting the currency.
- Unemployment: High unemployment weakens a currency as it reflects economic struggles.
- Central Bank Policies: Decisions like quantitative easing (money printing) or rate cuts can devalue a currency. For example, the ECB’s 2015 QE program weakened the euro.
- Geopolitical Events: Trade wars (e.g., U.S.-China tariffs), elections, or conflicts (e.g., Russia-Ukraine) can shift currency demand. A safe-haven currency like the Swiss Franc (CHF) often rises during global uncertainty.
- Market Reports: Traders watch releases like Non-Farm Payrolls (U.S. jobs data) or PMI (manufacturing activity) for immediate market reactions.
- Example:
- If the Bank of Japan keeps rates near zero while the U.S. hikes rates, traders might expect USD/JPY to rise as capital flows to the higher-yielding USD. A strong U.S. jobs report could amplify this move.
- Pros:
- Explains long-term trends.
- Ties directly to real-world economics.
- Cons:
- Data can be slow to act on (e.g., GDP is quarterly).
- Requires interpreting complex news and events.
- Who Uses It: Long-term investors, swing traders, and those trading major news events
- 3. Sentiment Analysis
- What It Is:
- Sentiment analysis measures the "mood" of the market—whether traders are optimistic (bullish) or pessimistic (bearish). It’s less about data and more about crowd psychology, often acting as a contrarian signal.
- How It Works:
- Tools and Data:
- Commitment of Traders (COT) Report: Released weekly by the CFTC, it shows positions held by commercial traders (hedgers) and non-commercial traders (speculators). If speculators are heavily long on a currency, it might signal an overbought market ripe for a reversal.
- Retail Sentiment: Brokers like IG or Oanda publish data on what percentage of their clients are long or short. If 80% of retail traders are long EUR/USD, a contrarian might bet on a drop, as retail traders often lose.
- News and Social Media Buzz: Spikes in chatter on platforms like X about a currency pair can reflect sentiment shifts.
- Market Positioning: Extreme bullishness or bearishness can signal overcrowding. For instance, if everyone’s betting on a USD rally, there might be few buyers left, leading to a pullback.
- Risk Appetite: When markets are "risk-on" (optimistic), currencies like AUD or NZD rise. In "risk-off" mode (fearful), safe havens like USD, JPY, or CHF gain.
- Example:
- If the COT report shows hedge funds piling into long GBP/USD positions while retail traders are 70% short, a sentiment trader might go long, betting the "smart money" (hedge funds) will prevail over the "dumb money" (retail).
- Pros:
- Great for spotting reversals or overextended trends.
- Complements technical and fundamental analysis.
- Cons:
- Hard to quantify precisely.
- Can lag behind price action.
- Who Uses It: Contrarian traders, hedge funds, and those looking to gauge market extremes.
- How They Tie Together
- Scenario: Imagine a trader eyeing USD/CAD.
- Fundamental: Canada’s economy weakens due to falling oil prices (a key export), suggesting CAD will drop.
- Technical: USD/CAD breaks above a key resistance level at 1.35 with RSI showing bullish momentum.
- Sentiment: COT data shows speculators heavily short CAD, hinting at a potential squeeze upward.
- Decision: The trader goes long USD/CAD, combining all three signals for confidence.
- Each type has its strengths: technical for timing, fundamental for direction, and sentiment for context.
What is Forex trading
What is Forex Trading?
Forex (foreign exchange) trading is the act of buying and selling currencies on the global market to profit from fluctuations
Different Forex Trading Strategies
Before diving into trading strategies, it’s crucial to understand what forex trading is. Forex, or foreign exchange trading, involves buying and selling currency pairs to profit from price fluctuations.
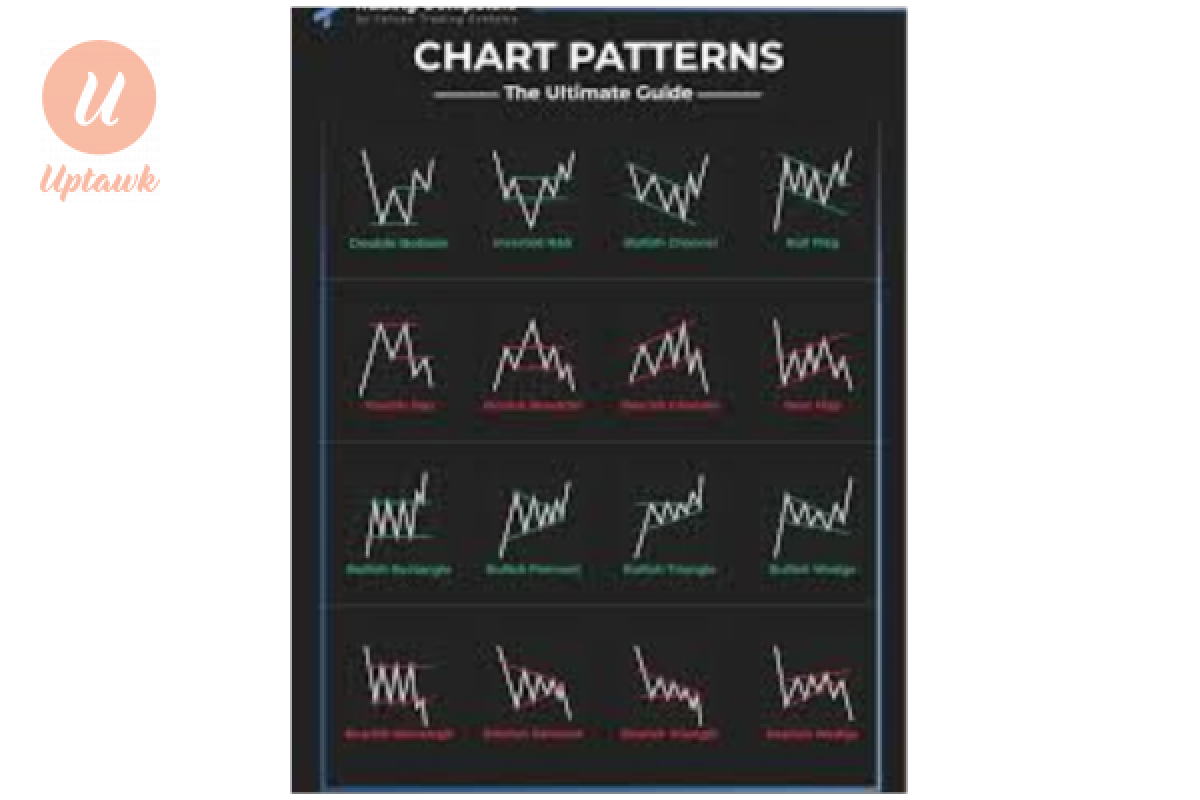
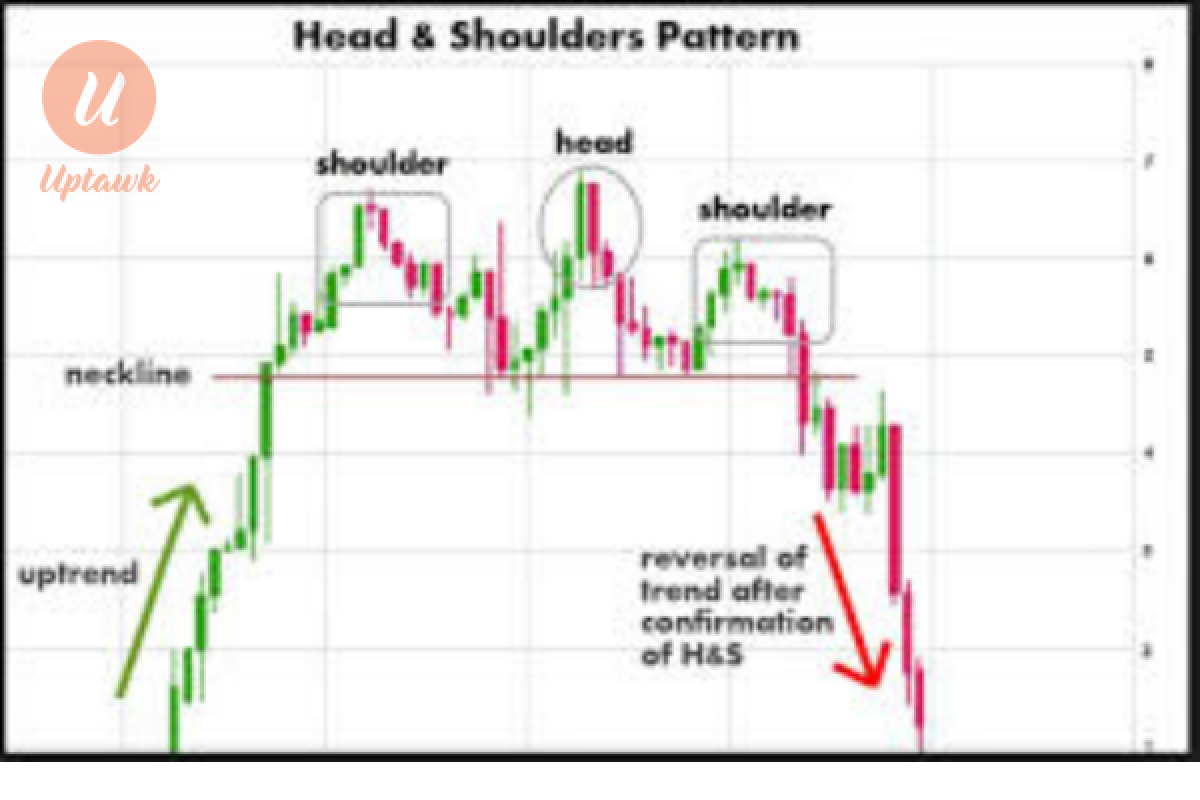
Charts Patterns
Forex trading can be profitable to individual traders but is not without risk. Most traders approach the market hoping to get quick results, but what really happens in forex trading is that it involves
Is Forex Trading profitable?

Comments 0 Comment