

How to properly draw support and resistance
Drawing support and resistance levels on a chart is a fundamental skill in technical analysis, widely used in trading and investing to identify key price levels where an asset’s price might pause, reverse, or break through. Below is a detailed, step-by-step explanation of how to properly draw support and resistance levels on a chart:
What Are Support and Resistance?
• Support: A price level where a downtrend tends to pause or reverse due to buying interest. It acts like a "floor" that prevents the price from falling further.
• Resistance: A price level where an uptrend tends to pause or reverse due to selling interest. It acts like a "ceiling" that caps the price from rising higher.
Note:These levels are not exact lines but rather zones where price action has historically reacted.


Step-by-Step Guide to Drawing Support and Resistance
1. Choose the Right Timeframe
• Short-term traders: Use 1-minute, 5-minute, or 15-minute charts.
• Swing traders: Use 1-hour, 4-hour, or daily charts.
• Long-term investors: Use daily, weekly, or monthly charts.
Higher timeframes (e.g., daily or weekly) tend to show stronger, more reliable support and resistance levels.
- Swing Lows: These are the "valleys" or lowest points in a price movement where the price stops falling and starts to rise. These often form support levels.
- Swing Highs: These are the "peaks" or highest points where the price stops rising and starts to fall. These often form resistance levels.
- Look for at least two or more points where the price has reversed at a similar level to confirm a zone.3. Draw Horizontal Lines at Key Levels
- Use your charting tool to draw horizontal lines:
- For support, connect two or more swing lows that are roughly at the same price level.
- For resistance, connect two or more swing highs at the same price level.
- Tip: The more times a price touches a level and reverses, the stronger that support or resistance becomes.
- (4) Focus on Zones, Not Exact Lines
- Prices rarely reverse at the exact same point every time. Instead of drawing a single precise line, think of support and resistance as zones (e.g., a range of 10-20 pips in forex or a few cents in stocks).
- To visualize this, you can shade the area or use a thicker line to represent the zone.
- 5. Use Historical Data
- Scroll back through the chart to see if the levels you’ve identified have been significant in the past. A level that has acted as support or resistance multiple times over weeks, months, or years is more reliable.
- Example: If a stock repeatedly bounces off $50 over six months, that’s a strong support level.
6. Incorporate Round Numbers and Psychological Levels
• Prices often react at round numbers (e.g., $100, $50, 1.2000 in forex) because traders and investors place orders at these psychologically significant levels.
• Check if your support or resistance aligns with these numbers—they often reinforce the level.
7. Watch for Role Reversal (Support Becoming Resistance and Vice Versa)
• When a support level is broken, it often becomes resistance in the future. Similarly, when resistance is broken, it can turn into support.
• Example: If a stock breaks above $75 (former resistance), that level may act as support if the price pulls back later.
Practical Example
• Imagine you’re analyzing a daily chart of a stock;
• You notice the price dropped to $45 three times in the past six months and bounced back up each time. Draw a horizontal line at $45—this is your support.
• The price also hit $60 twice and reversed downward. Draw a line at $60—this is your resistance.
• You see the stock recently broke above $60 and is now testing it from above. If it holds, $60 is now support.
Tips for Success
Patience: Wait for price to approach your levels and watch how it reacts before acting.
Context: Combine support and resistance with other indicators (e.g., RSI, MACD) for better decision-making.
False Breakouts: Be aware that prices can briefly break a level and then reverse—this is common in choppy markets.
By following these steps, you’ll be able to draw support and resistance levels accurately and use them to anticipate potential price movements. Practice on historical charts to build confidence, and over time, spotting these levels will become second nature! Let me know if you’d like a specific example with a real asset or chart.
What is Forex trading
What is Forex Trading?
Forex (foreign exchange) trading is the act of buying and selling currencies on the global market to profit from fluctuations
Different Forex Trading Strategies
Before diving into trading strategies, it’s crucial to understand what forex trading is. Forex, or foreign exchange trading, involves buying and selling currency pairs to profit from price fluctuations.
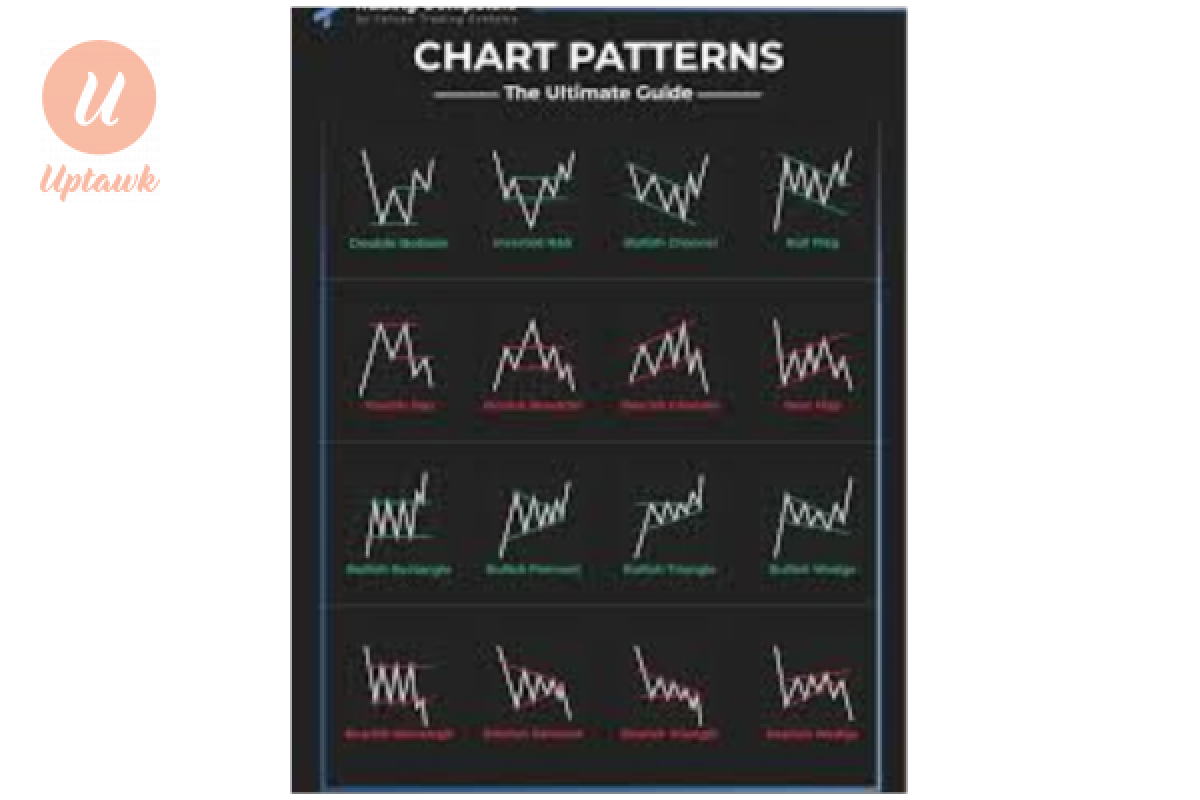
Charts Patterns
Forex trading can be profitable to individual traders but is not without risk. Most traders approach the market hoping to get quick results, but what really happens in forex trading is that it involves
Is Forex Trading profitable?

Comments 0 Comment